Metal strength decides whether your design holds—or fails. In 2025, engineers and makers balance tighter weight targets, cost pressures, and sustainability goals while comparing different types of metal strength — from tensile strength of metals and yield strength of steel to strength-to-weight trade-offs. This guide gives you the data and the “why” behind it, so you can pick the right metal for the load, the environment, and your budget without overbuilding.
You’ll get a current metal strength chart with typical ranges and a fast cheat sheet, a 5‑step selection workflow, key ASTM/ISO test standards, science-backed explanations in plain language, case studies across aerospace, EVs, and construction, 2025 market context, and links to authoritative resources. Need quick answers first? Start below, then move into detailed comparisons and step-by-step guidance.
Quick Answer: What is metal strength and which metals lead in 2025?
Metal strength refers to the ability of a metal to resist load without breaking or deforming — in other words, it’s the strength a metal can withstand when a force is applied. For example, the breaking strength of steel is a key reference in many structural applications. In practice, most teams use three metrics to compare metals: tensile strength, yield strength, and strength-to-weight ratio.
Key metrics at a glance: tensile strength, yield strength, strength-to-weight ratio
- Tensile strength: the maximum stress before fracture, often called ultimate tensile strength of metals (UTS), given in MPa. It answers, “How much stretching a metal can withstand before it snaps.”
- Yield strength: the stress at which plastic (permanent) deformation starts. This is the safe limit for many designs.
- Strength-to-weight ratio: strength divided by density. It tells you how strong the metal is for its weight. This is critical for aerospace and EV range.
To put it simply, yield strength and tensile strength help you avoid permanent bends and sudden breaks. Strength-to-weight helps you meet mass and range targets.
Strongest by category (rapid shortlist)
- Highest strength-to-weight: titanium alloys (like Ti-6Al-4V), magnesium alloys, and select 7000‑series aluminum.
- Highest tensile at high temperature: nickel‑based superalloys (for example, Inconel family).
- Cost‑effective high strength: high‑strength steel (HSS) and advanced high‑strength steel (AHSS).
2025 snapshot ranges (common engineering alloys)
- Steel: 400–2500 MPa tensile; 250–1500 MPa yield; density 7.8 g/cm³
- Aluminum: 70–600 MPa tensile; 30–400 MPa yield; density 2.7 g/cm³
- Titanium: 480–1150 MPa tensile; 275–950 MPa yield; density 4.5 g/cm³
- Magnesium: 180–350 MPa tensile; 70–200 MPa yield; density 1.7 g/cm³
- Inconel: 800–1600 MPa tensile; 550–1300 MPa yield; density ~8.5 g/cm³
These are broad ranges. The exact value depends on the alloy and heat treatment. Always check the data sheet for the specific grade you will buy.
10‑second cheat‑sheet table
| Best For | Top Metric | Typical Applications |
| Lightweight + high strength | Strength-to-weight ratio | Airframes, EV battery enclosures, space hardware |
| Highest hot strength | High-temp tensile and creep | Turbines, exhaust, chemical plant |
| Value + high strength | Yield strength and cost | Safety cages, beams, frames |
| Corrosion + strength | Strength + corrosion resistance | Marine hardware, medical devices |
| High conductivity + moderate strength | Electrical properties | Busbars, heat exchangers |
Metal Strength Chart (2025): Tensile, Yield, Density
The table below compares typical properties for widely used families — a quick look at how the strength of steel, aluminum, titanium, and other metals stack up in yield strength and tensile strength values. The “Relative S/W” is a simple strength‑to‑weight index using UTS/density, normalized to steel = 1.0 to make quick comparisons easier. Use this as a starting point, then confirm with the specific grade and temper.
Why normalize strength-to-weight? It speeds up early selection. For example, if you need the same UTS as steel but at half the mass, titanium or a high‑strength aluminum may be the better fit, subject to cost and temperature.
Strength-to-weight ratio explained
Density is the quiet driver behind many choices. An AHSS may have a UTS near 1200 MPa, but its density is 7.8 g/cm³. A Ti‑6Al‑4V titanium alloy with about 1000 MPa UTS weighs ~40% less by volume. For weight‑critical parts, that gap matters. High‑strength 7000‑series aluminum can also rival steel’s yield strength but at roughly one‑third the density, which is why you see it in airframes and EVs. On the other hand, when temperature rises above ~200–300°C, aluminum loses a large share of its strength, and you may move to titanium or nickel‑based superalloys.
Sources to cite for property ranges
Use data sheets and databases for the specific alloy and temper: MatWeb, ASTM/ISO standard methods, and manufacturer PDFs. Small changes in chemistry or heat treatment change strength, ductility, and hardness.
What is the weakest metal?
When comparing metals by strength, it’s easy to focus only on the strongest options — steel, titanium, or nickel superalloys. But knowing the lower end of the spectrum is just as important for design decisions. For common structural metals, magnesium sits at the lower end, with tensile strength around 180–350 MPa. It’s soft compared to steel or titanium, but extremely lightweight, making it valuable for aerospace and automotive parts where cutting mass matters more than absolute strength. Other metals like lead and tin are even weaker, below 100 MPa, but they are used for shielding or coatings rather than structural applications. Understanding the weakest metals helps you avoid accidental under-specification and highlights why strength-to-weight is often more important than absolute tensile numbers.
Now that we’ve looked at the range from weakest to strongest metals, the next step is figuring out which metal best suits your project. The following 5‑step workflow breaks down the selection process in a clear, practical way.

How to choose a metal by strength: A 5‑step workflow
Choosing the right metal for your project is part numbers and part context. You do not need a PhD. You need a clear process.
Step 1—Define load cases and environment
Start with the loads your metal part will see. Is the load static, cyclic (fatigue), impact, or a mix? Will the part face creep (high temperature + time)? What about corrosion (marine, chemical splash), wear, or UV? Note your safety factors and any standards you must meet. A safety cage sees impact and fatigue; a turbine blade sees creep and hot corrosion; a bridge beam sees cyclic truck loads and weather.
Step 2—Translate requirements into specs
Convert the scenario into numbers. Set target yield strength to avoid plastic bend, and target tensile strength so the part will not snap. Note any hardness range to resist wear. If fatigue is critical, get S‑N curve inputs. If ductility matters, note a minimum elongation. For example, a structural steel choice might require a yield strength of 260 MPa and tensile strength of 580 MPa, typical of medium-strength steels. These numbers describe the force a metal can withstand before deforming or fracturing — key for picking the right metal for your project, which is common in many global building codes. Another project might call for yield strength of 246 MPa in a stainless sheet with moderate corrosion resistance, paired with a typical tensile strength near 600 MPa.
Step 3—Evaluate trade‑offs
Now weigh the trade‑offs: cost, availability, machining, joining, certification, and recyclability. Ask:
- Can your shop CNC mill or CNC turn the alloy? Some high tensile strength steels are hard to machine, while lower-strength aluminum grades are easier but may not meet your load targets. Titanium cuts well but needs the right feeds, speeds, and coolant. Magnesium machines fast but needs tight chip control and fire safety.
- Can you weld it? Some aluminum series (like 2xxx and 7xxx) need care, and some nickel alloys need strict heat input control.
- Is there a corrosion or temperature risk that shifts you toward stainless, titanium, or a superalloy?
- Are there sustainability or recycled content targets to hit?
Step 4—Shortlist with a decision matrix
Make a short table with your weighted criteria. Score 3–5 alloys. Include yield, tensile, density, impact strength, cost, machinability, weldability, and corrosion resistance. Shortlist the best two.
Step 5—Validate with analysis and tests
Run quick FEA checks for stress hotspots and buckling. If fatigue matters, use an S‑N curve and include a notch sensitivity factor. For critical parts, cut samples and run lab tests using a universal testing machine. Follow ASTM E8/E8M or ISO 6892 for tension tests so results are comparable. Confirm hardness and impact if needed. Iterate with the supplier if a tweak in temper or heat treatment will hit your numbers.
Testing methods and standards for metal strength
Before testing metal strength, standards like ASTM and ISO ensure consistent, reliable results. Here are the main test methods used to measure different strength properties.
Tension and yield tests
Tension tests produce a stress–strain curve and the 0.2% offset yield strength (the usual design point). The test is well defined by ASTM E8/E8M and ISO 6892. Results vary with strain rate, test temperature, and specimen geometry. That is why test standards and careful specimen prep matter. The curve also gives you elastic modulus, uniform elongation, and reduction in area.
Hardness and impact toughness
Hardness is a quick proxy for strength and wear. It is measured by indentation:
- Brinell (ASTM E10) is good for castings and coarse structures.
- Rockwell (ASTM E18) is common for steels and many alloys.
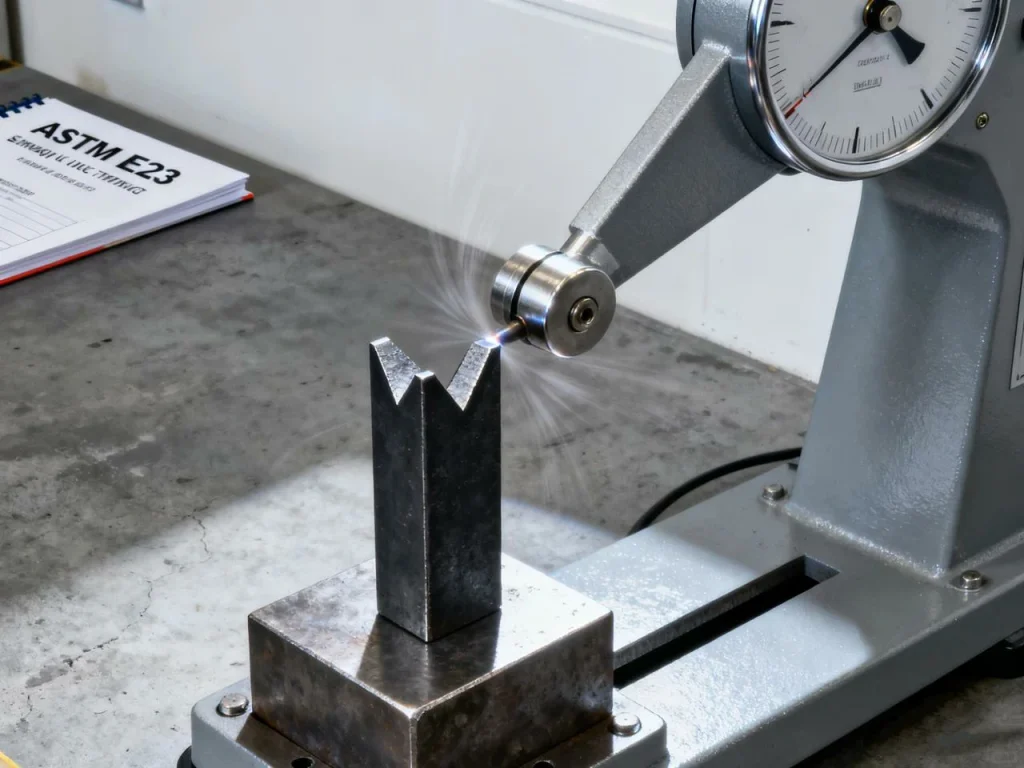
- Charpy V‑notch (ASTM E23) measures impact energy absorbed. This matters at low temperatures and for crash structures.
You can estimate tensile strength from hardness for some steels, but treat it as a rough guide. When the microstructure changes (for example, precipitation‑hardened aluminum vs martensitic steel), the correlation shifts.
Fatigue and creep
For cyclic loads, use ASTM E466 (axial fatigue) or ASTM E606 (strain‑controlled). Fatigue does not show on a simple tensile test. Surface finish, notches, and mean stress can change life by orders of magnitude. For long service at heat, ASTM E139 covers creep testing. Engineers often use the Larson–Miller parameter to estimate time‑to‑rupture at temperature.
How accurate are metal strength tests?
When you follow the standard, you can expect good repeatability, but there is always scatter. Grip slippage, misalignment, or slightly off cross‑section can shift numbers. Testing labs use calibrated machines, strict temperature control, and repeat runs to get confidence intervals. This is also why different data sheets for the “same” alloy do not always match.
Scientific fundamentals: Why metals are strong
Strength is defined at the atomic and microstructural level — how well a metal can resist deformation when force is applied. Metal strength starts with its atomic and microstructural behavior. How atoms bond, how grains form, and how dislocations move all decide how a metal resists deformation. Understanding these scientific fundamentals explains why different alloys—and even different heat treatments—can have such different strength levels.
Microstructure mechanics
At the crystal level, metals deform by dislocation motion. Anything that blocks dislocations raises strength — this is why strength and hardness often rise together, and why strength is the maximum amount of stress a metal can absorb before yielding. Smaller grains create more boundaries, so strength rises as grain size drops (this is the Hall–Petch effect). Solute atoms and precipitates pin dislocations. That is why solid‑solution and precipitation hardening work so well.
Processing and strengthening routes
Heat treatment and cold work change the internal structure. Quenching and tempering in steels form and temper martensite to balance strength and toughness. Age hardening makes fine precipitates in 2xxx and 7xxx aluminum that boost ultimate strength. Cold work raises strength but cuts ductility. The best property sets come from the right microstructure for the job, not just the highest number on a chart.
Alloying strategies by family
- UHSS/AHSS often use Cr, Mo, V, and controlled cooling to form bainite or martensite.
- Aluminum 2xxx/6xxx/7xxx rely on copper, magnesium, silicon, and zinc for precipitation hardening.
- Titanium (Ti‑6Al‑4V) uses alpha‑beta microstructures for strength and good fracture toughness.
- Nickel superalloys use gamma prime precipitates to hold strength at high temperatures.
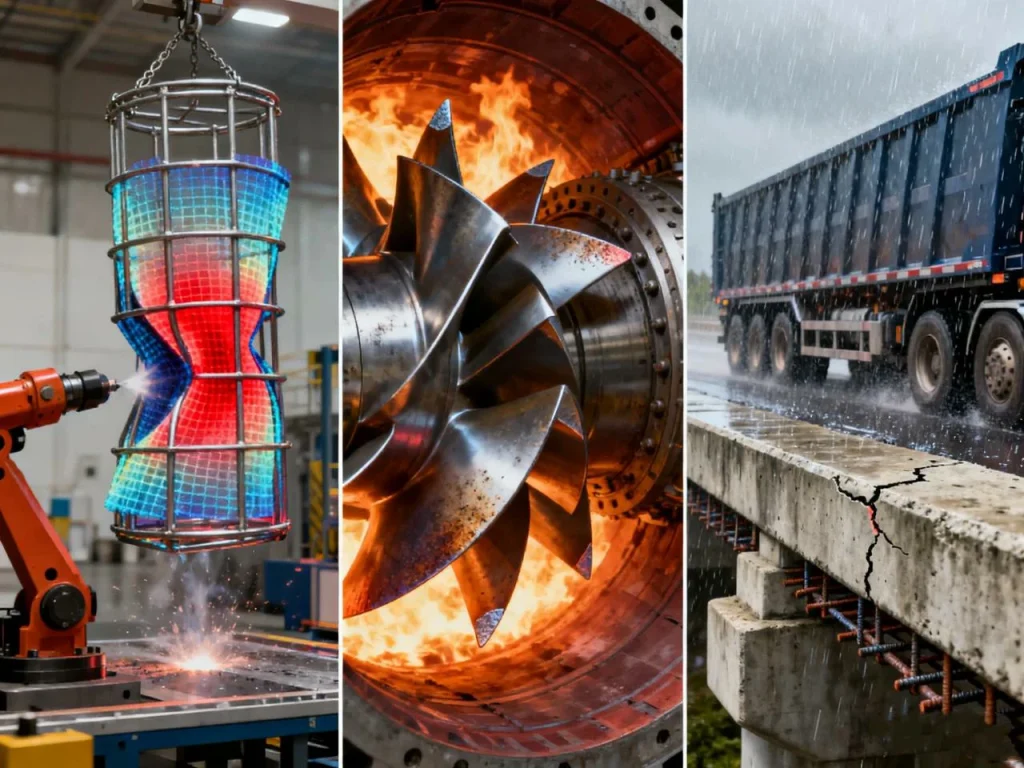
Applications and case studies: Aerospace, EVs, construction, high temp
How metal strength translates into real performance depends on where it’s used. From aircraft and EVs to skyscrapers and turbines, each field balances strength, weight, cost, and environment differently. The following examples show how engineers apply strength principles to meet demanding design goals across industries.
Aerospace selection trade‑offs
Aircraft parts live on a tight mass budget and face fatigue, corrosion, and sometimes heat. Airframes often use high‑strength aluminum for stiffness and lower cost. Titanium brings higher strength-to-weight and corrosion resistance for landing gear, key fasteners, and some engine parts. It is common to choose Ti‑6Al‑4V for components that must carry heavy loads without mass penalty and where corrosion cannot be ignored. When the environment is very hot, nickel-based superalloys become the default.
Automotive and EVs
EV range pushes weight down, but crashworthiness and cost remain. This leads to mixed‑material designs: AHSS for the safety cage and crush zones, aluminum for body panels and battery enclosures, and some magnesium for covers. The trick is joining and managing galvanic corrosion between dissimilar metals. You will also see smart use of topology optimization to trim mass while keeping tensile and yield margins.
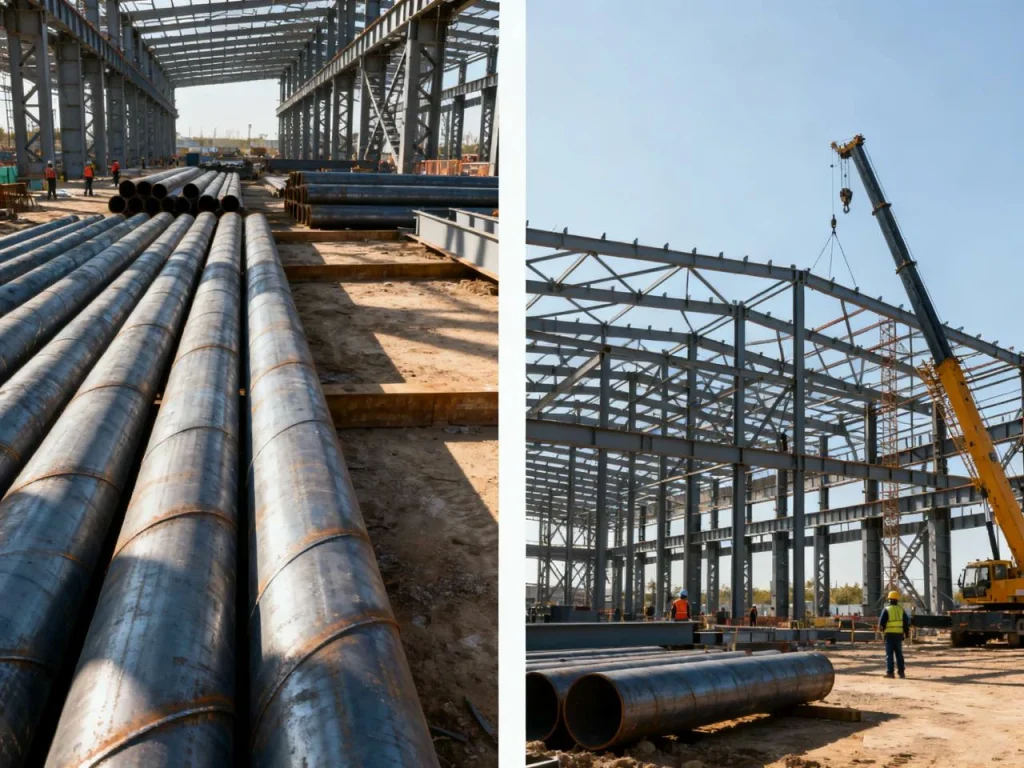
Construction and infrastructure
High‑strength structural steels allow lighter spans and faster builds while meeting safety codes. Lighter beams mean smaller cranes and lower transport energy. The market for high‑strength structural steel is set for steady growth as design codes accept higher grades, and as infrastructure spending targets life‑cycle cost and lower embodied carbon.
High‑temperature and corrosive environments
In turbines and chemical plants, Inconel grades and other nickel alloys handle heat, oxidation, and stress. At a glance, stainless steel looks cheaper, but repeat replacements and downtime erase that early win. If you add creep resistance and corrosion over years of service, the “expensive” alloy can deliver the lowest life‑cycle cost.
2025 market trends, pricing, and supply for strong metals
Metal strength isn’t just about engineering—it’s also about economics. Global demand, raw material costs, and supply chain stability all shape which metals industries actually use. Here’s a snapshot of 2025 market trends, pricing, and supply outlook for the key strong metals.
Steel overview
Global crude steel production sits near 2 billion tonnes per year, with China around half the output. Short‑range forecasts call for modest demand growth around the low single digits in 2025. Prices vary by region and product, with U.S. hot‑rolled coil around the high hundreds of dollars per ton in recent quarters and European flats in a similar band when converted. Construction, automotive, and service centers absorb the bulk of shipments. For many projects needing high yield strength, steel remains the best value per MPa if weight is not critical.
Aluminum overview
Primary aluminum production is above 70 million tonnes yearly, with a large share from Asia. Demand in 2025 is supported by EVs, renewable energy hardware, and packaging. Exchange prices have been firm in the $2,400–2,600 per tonne range recently, with premiums for low‑carbon metal. The light mass and high strength-to-weight of 6xxx and 7xxx series keep aluminum on the shortlist when range and payload matter.
Titanium and magnesium
Titanium is niche but growing in aerospace and medical. It is not cheap, but when you need high-strength metal with great corrosion resistance and high impact strength in salt water, it is hard to beat. Magnesium remains a strong candidate for lightweight housings where stiffness and corrosion management are covered by design and coatings. Both metals depend on specialty processing and stable supply chains.
Is aluminum replacing steel in EVs?
It depends on the part. Aluminum often wins for closures and battery trays thanks to mass savings, while AHSS still leads in crash structures due to impact strength and cost. Most EVs use a mixed‑material strategy, not an all‑aluminum or all‑steel body.

Beyond strength: Weight, fatigue, temperature, sustainability
Strength is only part of the story. In real-world design, engineers also weigh factors like weight, fatigue life, temperature limits, and sustainability. The best metal isn’t just the strongest—it’s the one that stays strong, light, and durable under actual service conditions.
Strength-to-weight and energy efficiency
Lower mass reduces energy use. That is true for planes, trucks, and EVs. A higher strength-to-weight ratio lets you carry the same load with less metal. Pair that with topology optimization and you can meet strength targets with fewer kilograms. That change ripples through cost and range.
Temperature, corrosion, and fatigue life
Strength numbers are often room‑temperature values. Real parts face heat, salt, UV, vibration, and knocks. Aluminum loses strength at modest heat. Some steels embrittle in cold. Fatigue can fail a part far below its ultimate strength. It pays to check a knockdown chart, pick coatings, or move to a better alloy for the environment.
Sustainability and recyclability
Steel and aluminum have high recycling rates. Recycled aluminum saves a large share of energy compared to primary. Some buyers now ask for low‑carbon metal with proof of origin. Designing parts for disassembly and single‑metal assemblies helps future recycling.
What’s the best metal for marine environments?
There is no single winner. Stainless works well with the right grade and design. Titanium is top tier if you can afford it and need long life. Aluminum with coatings can be fine, but watch galvanic pairs. Think long‑term: fasteners, crevices, and mixed metals often decide success.
Key takeaways and next steps
Choosing the right metal means balancing data, design, and real-world limits. Before finalizing a material, it helps to run through a quick checklist and watch for common mistakes that can undermine performance or compliance. Here are the key takeaways and next steps to guide smart, reliable metal selection.
Decision checklist
- Load type: static, cyclic, impact, creep?
- Environment: temperature, corrosion, wear?
- Targets: yield MPa, tensile MPa, hardness, elongation?
- Fatigue: S‑N data and surface finish?
- Manufacturing: CNC milling, CNC turning, forming, welding?
- Cost and availability: lead time and spec requirements?
- Sustainability: recycled content, embodied carbon?
- Standards: test method, certification, traceability?
Top 5 pitfalls to avoid
- Mixing up tensile and yield strength in the design checks
- Ignoring temperature or fatigue knockdowns
- Relying on hardness‑to‑tensile conversions without validation
- Overlooking machinability or weldability limits
- Not verifying the exact alloy and heat treatment on the purchase order
Practical manufacturing notes: milling, turning, and forming
When you move from chart to chip, details matter. CNC turning favors materials with steady chip formation; alloys that string can need chip breakers and tuned feeds. CNC milling of high‑strength steel uses lower surface speeds and robust fixturing. Titanium wants sharp tools, high pressure coolant, and stable engagement to manage heat. Magnesium machines very fast, but you must control dust and chips and follow fire safety rules. For thin sheet metal, forming limits tie back to ductility and the strain‑hardening curve, not just ultimate tensile strength. When in doubt, ask your supplier for machinability and forming notes for the exact grade and temper. Companies like U-Need specialize in precision CNC machining and can provide detailed guidance or custom parts for challenging alloys, ensuring your design meets strength and tolerance requirements.

Putting it all together with a simple selection story
Say you are choosing a bracket that must hold a static load with some vibration, fit a tight mass budget, and live near a warm battery pack. You start with weight, so you look at aluminum 7xxx and titanium. The battery heat knocks aluminum down, and the part’s mounting holes see cyclic loads. Titanium edges out aluminum on fatigue and heat. Steel would be cheaper, but the mass hurts range. A quick decision matrix and an FEA check show titanium winning by a small margin. You confirm yield and tensile targets from the data sheet, run a tensile coupon to ASTM E8, and validate the bolt pattern with a fatigue test. You adjust feed and speed for CNC milling, order stock with test certs, and release the part.
FAQs
What is the strength of a metal?
Strength is basically how much force or load a metal can take before it bends or breaks for good. In technical terms, engineers look at yield strength (the point where it starts to bend permanently) and tensile strength (the point where it actually breaks). Depending on the application, they might also check compressive strength (how well it resists squeezing) and impact strength (how much shock it can handle before cracking). In everyday words — strength tells you how tough the metal is under pressure. For example, steel beams hold up skyscrapers because they have high tensile and yield strength, while softer metals like aluminum might deform sooner. So, in one sentence: strength means how much stress a metal can take before it permanently gives way or fractures.
What are the top 10 strongest metals?
If we rank metals and alloys by their ultimate tensile strength (UTS) at room temperature — the maximum stress they can take before breaking — here’s a solid “top 10” list often used in engineering. Exact rankings can shift depending on composition, treatment, and temperature, but this gives a real-world snapshot:
| Rank | Metal or Alloy (Representative) | Typical UTS (MPa) | Notes |
| 1 | Maraging steel / Ultra-High-Strength Steel (UHSS) | 1900–2500 | Extremely tough; used in aerospace and tooling |
| 2 | Nickel superalloys (e.g., Inconel) | 1000–1600+ | Retain strength even at high heat; perfect for jet engines |
| 3 | Tungsten (pure) | ~1000–1510 | Strongest pure metal known |
| 4 | Titanium alloys (Ti-6Al-4V) | 900–1100+ | Incredible strength-to-weight ratio |
| 5 | Tool steels (tempered) | 800–2000 | Great for cutting tools and dies |
| 6 | Stainless steels (martensitic/PH) | 700–1400 | Balanced corrosion resistance and strength |
| 7 | Cobalt-based alloys | 900–1200 | Excellent wear and corrosion resistance |
| 8 | Chromium (pure) | ~560–700 | Very hard but brittle on its own |
| 9 | High-strength aluminum (7xxx series) | 500–600+ | Lightweight yet strong — used in aircraft |
| 10 | Magnesium alloys (AZ series) | 200–320 | Lightest structural metal; moderate strength |
Quick note: Some materials like tungsten carbide are harder than steel, but technically they’re not pure metals — they’re cermets (ceramic + metal composites).
Which metal is the weakest?
If we’re talking about common structural metals, magnesium sits at the lower end of the strength chart, with tensile strength around 180–350 MPa. It’s soft compared to steel or titanium, but don’t underestimate it — it’s extremely lightweight, which makes it valuable for aerospace and auto parts where cutting weight matters more than absolute strength. Metals like lead and tin are even weaker (below 100 MPa) but are used for other reasons — for example, lead for shielding and tin for coatings — not for structural load. So while magnesium is the “weakest” in raw numbers, it still has a great strength-to-weight advantage.
What is the strongest metal by tensile strength?
If you only count pure metals, tungsten wins hands-down with the highest tensile strength — it can take incredible stress before snapping. But in real engineering use, ultra-high-strength steels and nickel-based superalloys can actually outperform tungsten because they can be shaped, welded, and treated for specific conditions. That’s why aerospace and defense industries often rely on those advanced alloys — they’re strong and workable, while tungsten is dense and brittle to machine.
What material is 100 times stronger than steel?
That phrase usually refers to graphene — a single layer of carbon atoms arranged in a honeycomb pattern. In lab tests, graphene shows a tensile strength about 100 times greater than steel by weight, which sounds wild! But here’s the catch: it’s not a metal, and it’s not something you can build a car chassis out of (yet). Think of it as a futuristic wonder material — incredibly strong and light in thin films — but still far from replacing traditional structural metals like steel or titanium in practical applications.
How thick of metal can a CNC machine cut?
That depends on what kind of CNC machine and cutting process you’re using.
- A CNC milling machine removes metal with spinning cutters (end mills). Its limit isn’t “thickness” but tool reach and rigidity. Milling pockets 75–150 mm deep is common, but going deeper requires special long-reach tools or multi-step setups.
- A CNC laser cutter can slice through 6–25 mm steel, depending on laser power (2–10 kW is typical).
- CNC plasma cutting can handle 25–50+ mm steel, great for heavy plate work.
- Waterjet cutting is the champ for versatility — it can cut 50–150+ mm of almost any metal, including titanium or Inconel.
In short: there’s no single “max thickness” — it’s all about the machine power, tool type, and setup stability.
What metal is harder than steel?
When it comes to hardness — not tensile strength — a few materials beat typical steel. Tungsten carbide, for instance, is much harder (used for cutting tools and drill bits). Chromium coatings also score higher on the hardness scale and protect surfaces from wear. Some tool steels and martensitic stainless steels become extremely hard after heat treatment too, though they might lose toughness in return. In short, “harder” doesn’t always mean “stronger” — hardness helps resist scratches and wear, while strength helps a metal resist breaking. Always pick the property that fits your job.